Pricing Toolkit: Pricing life-cycle decision board for the Aftersales Department of an Automotive Manufacturing Giant
Skills Employed
- Modelling Techniques: Regression Models - Linear Regression, Lasso Regression, Random Forest regression, Time Series Forecasting (ETS, ARIMAX), Clustering (K-means, PAM, DBSCAN)
- Other Statistical Techniques: Model Ensembling, A/B testing
- Tech Stack: SQL (Oracle), SAS, R
- Libraries: caret, forecast, stats, fpc, DBSCAN, shiny (RShiny)
Introduction
This project aimed to create a sustainable pricing decisionboard for the aftersales division of an automotive manufacturer. The decisionboard followed a DIPP (descriptive, inquisitive, predictive and prescriptive) approach to help pricing managers in the complete pricing life-cycle. There were 4 modules in this project are:
- Reporting: Descriptive analytics module providing both an overview of part pricing for various product portfolios as well as an in-depth analysis for part-wise and portfolio-wise pricing trends
- Pricing Anomalies: Inquisitive analytics module providing an insight in anomalous price points for each part in a portfolio and identifying the types of anomalies (for example: similar parts priced at significantly different prices, parts priced at a significantly different point from the last recommendation etc.)
- Pricing Recommendations: Prescriptive module providing price recommendations based on competitor pricing, part life-cycle pricing, price elasticity estimation and on the basis of past price changes.
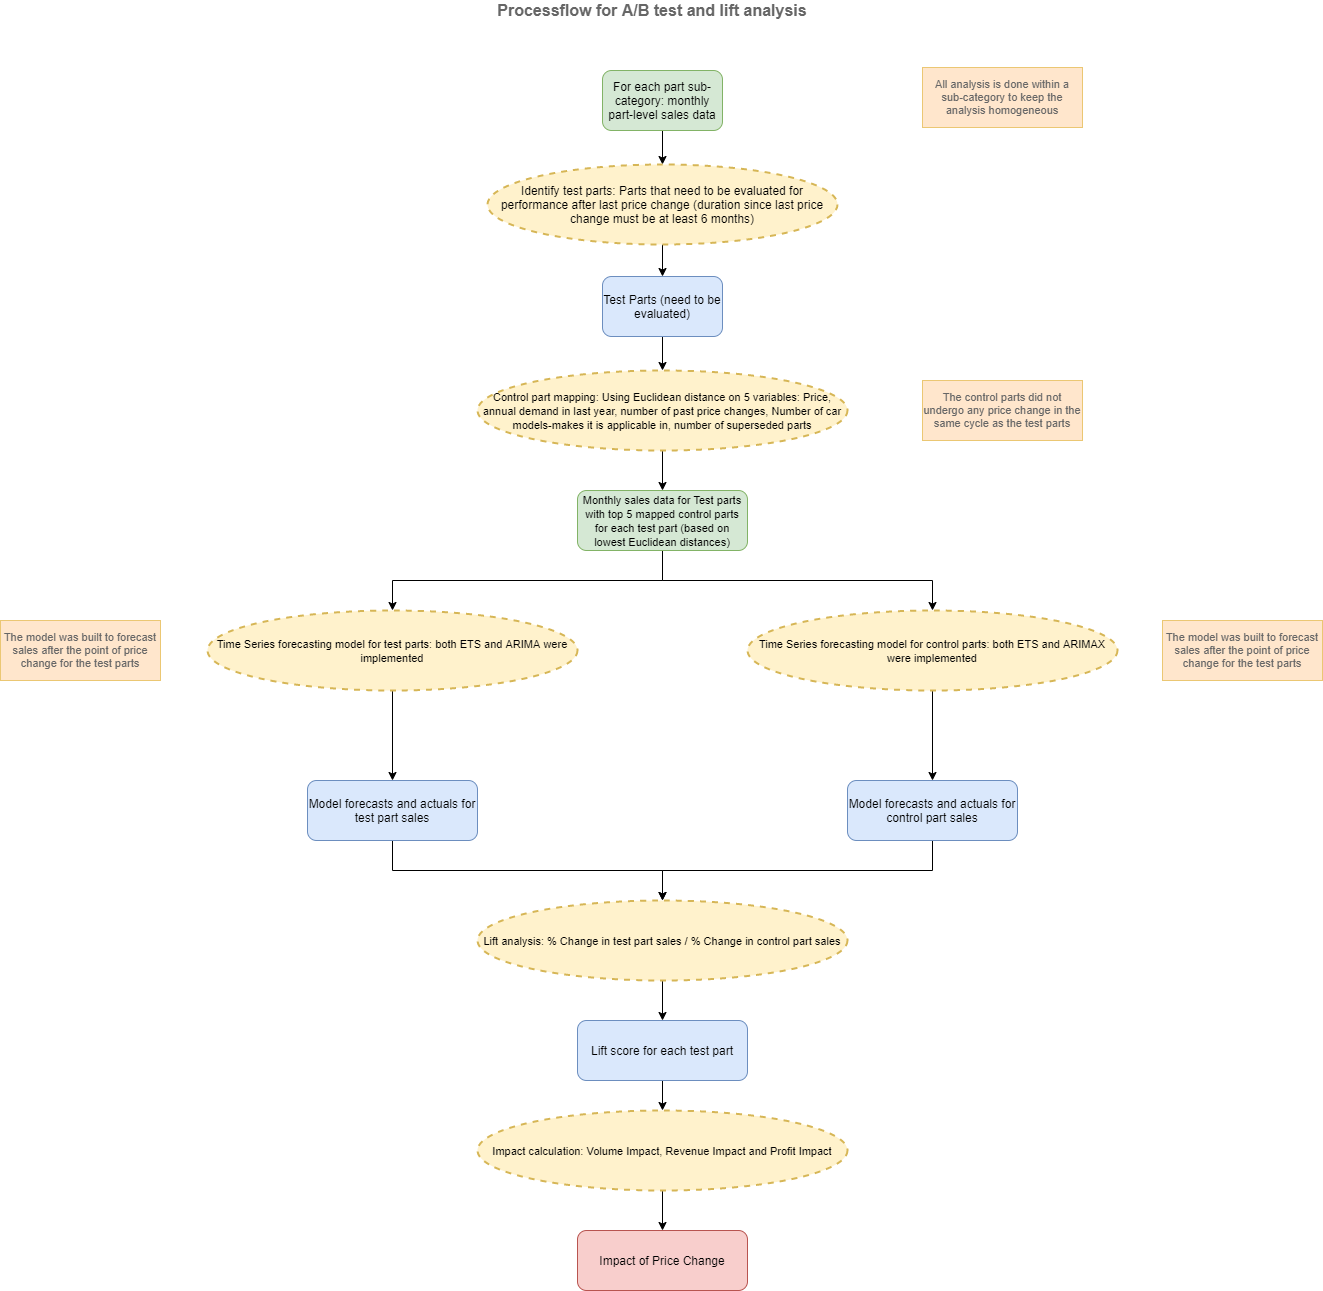
- Post-pricing Audit: Causal (and predictive) analysis module describing the causal impact of past price changes using A/B tests and lift analysis.
Methodology
This project was executed in phases. There were 4 main analytical workflows employed in this project. Below is a brief description of each workflow.
Creation of Analytical Dataset
The first steps was to join multiple datasets (ex: parts metadata, part sales data, parts supersession data, dealers data, parts suppliers data etc.) and create a single analytical dataset for all part-level analysis. For this, we worked on the Oracle SQL database. In this step, we had to employ concepts of the standard ETL pipeline to extract (filter), join and roll up some datasets. Some of this data fed directly into the reporting module of the pricing toolkit.
Price Recommendations
Price Elasticity
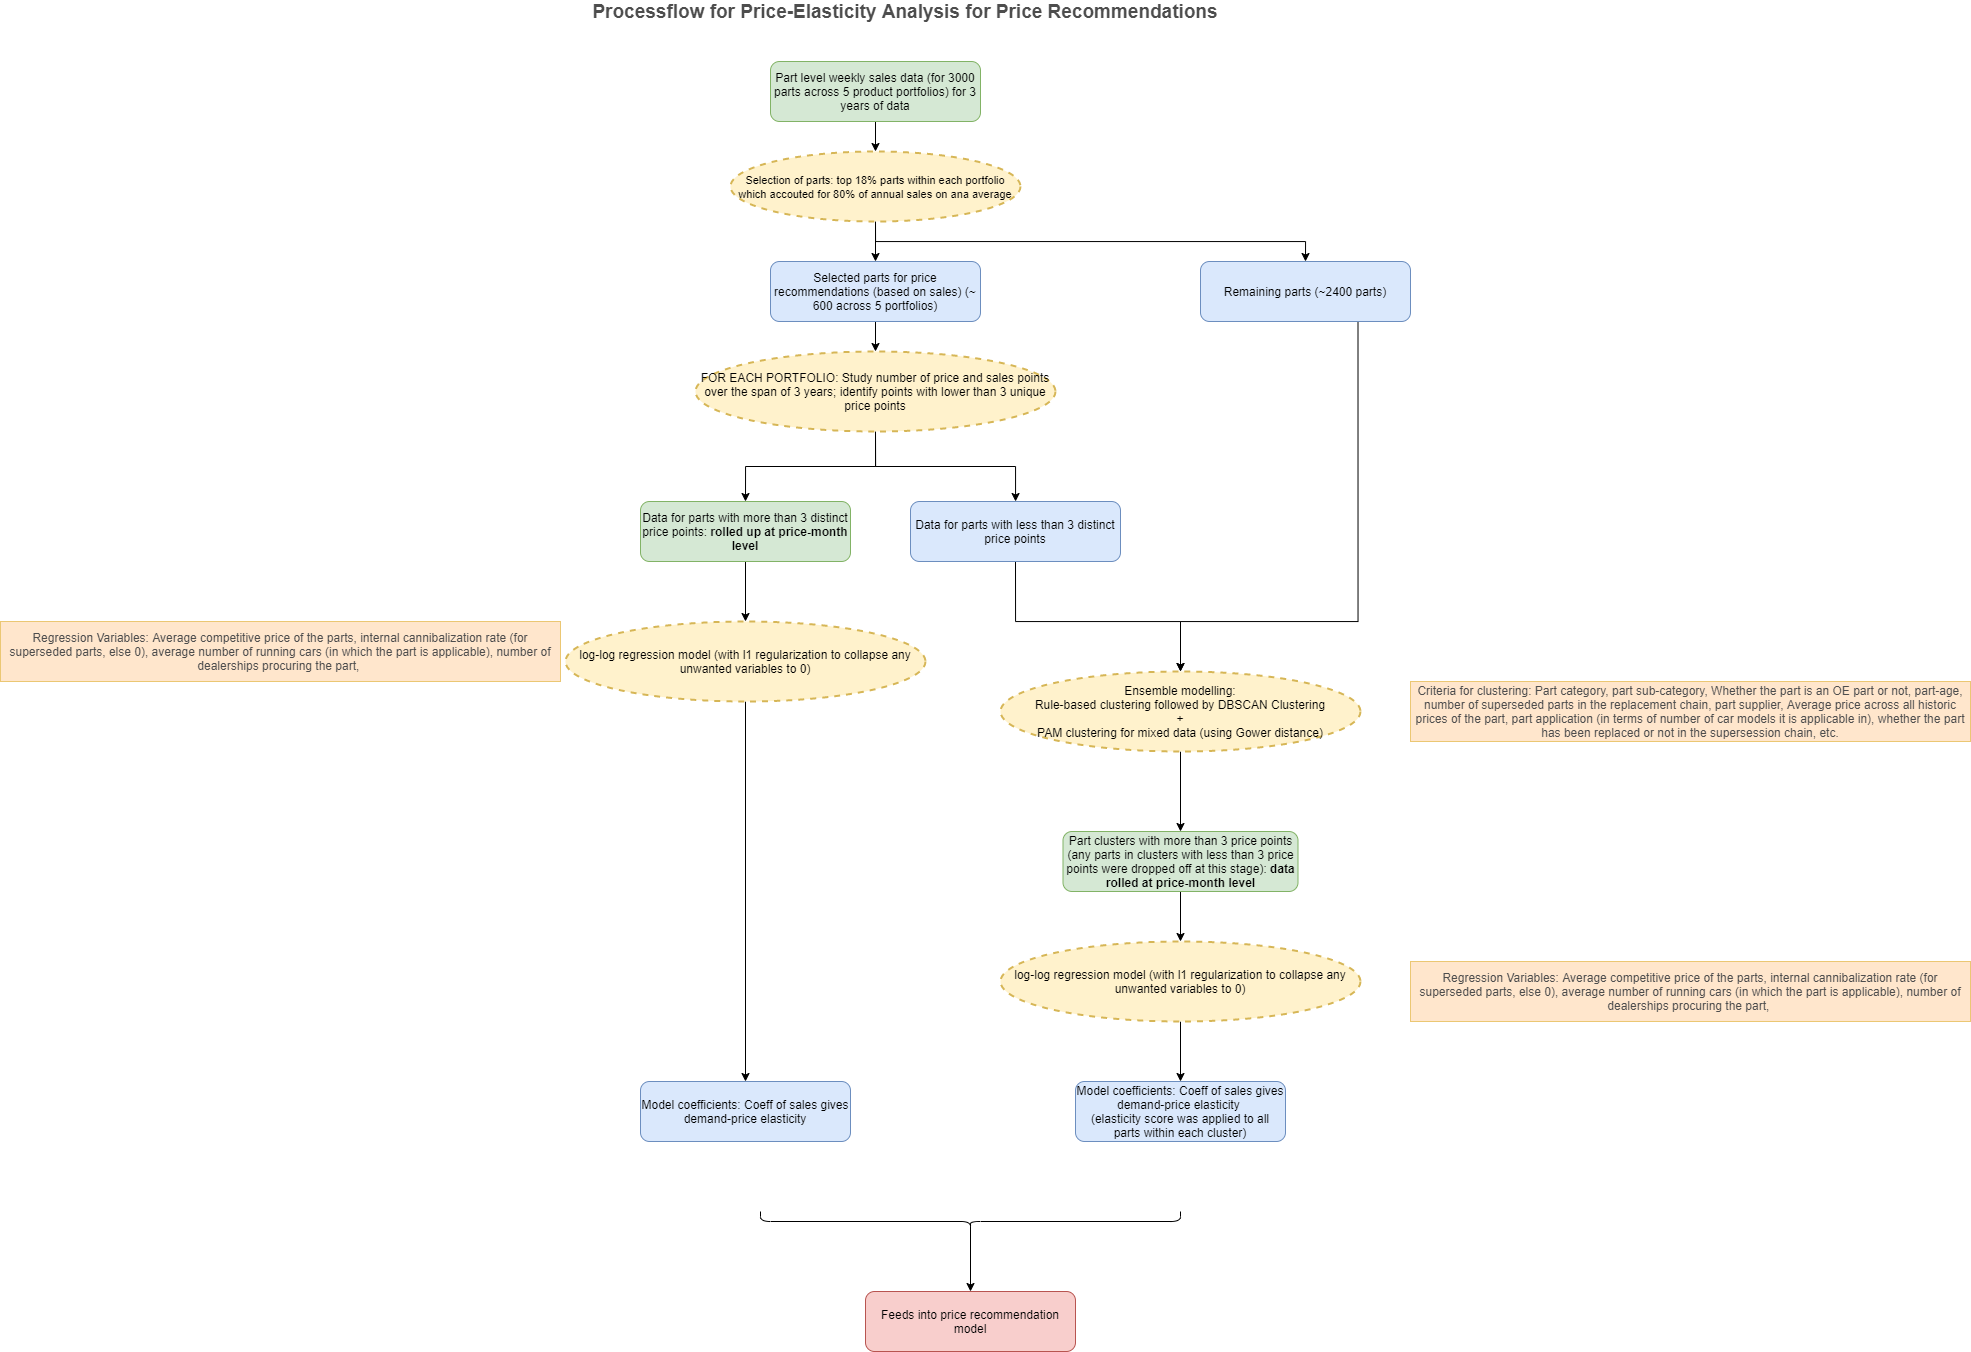
In this step, we created a modelling framework to compute demand-price elasticity scores of a part. These scores fed into a subsequent recommendation model as an independent variable. A detailed workflow for the analytical process has been given below. Some of the challenges we faced and solved in this step were:
- Huge amount of parts: Since there were a large number of parts, we applied a filtering criterion using the Pareto Principle on the sales. This led to us choosing the top 18% parts for our analysis.
- Too few price points: Some parts were too new, while some parts had not undergone a lot of price change. Hence, we split the analysis into individual part level analysis(for parts with more than 3 price points) and cluster level analysis(for parts with less than 3 price points)
- Supersession of parts: In the manufacturing industry, some components (here, parts) get replaced by functionally similar parts(due to innovation, supplier contracts etc.). This might lead to a sudden drop of increase in part sales. To take care of this, we used information of part supersession both while clustering parts and as internal cannibalization rates in the regression model.

Price Recommendation Model
In this step, we built a regression model (ensemble of Linear Regression and Random Forest) to predict a price point given some variables like (but not limited to) price elasticity, YoY sales, last price point, age of part, current competitor price, part category etc. This model is confidential and so cannot be explained further here.
Post-pricing Audits
An overview of the process followed for this module has been given below.

Toolkit GUI
For the implementation of the dashboard, we did so using RShiny as this gave us the flexibility to connect the backend (data extraction), middleware (modelling and EDA) and the frontend in a homogeneous manner. It was an interactive dashboard that gave the users the flexibility to tweak levers and analyze things differently, like changing variables in a regression model for elasticity computation or changing list/number control parts for a test part in the A/B tests. This tool is used extensively by the in-house data scientists of the client team.
Impact
This was a 2-year long project for an automotive client at Mu Sigma. Using this tool, we were able to automate a lot of mechanical processes in the pricing operations for the team. We were able to reduce the pricing cycle time of the North America pricing team by an average of 40%. In a particular example of post-pricing audit analysis, we estimated the causal impact of our pricing recommendations for the brakes product portfolio. This came out to be a profit impact of ~$60k in 1 year in the North American market. The revenue impact for the same was ~$250k.